


2018 and 2023 winter deaths
And the stark contrast with 2020, not least in terms of government reaction and media coverage
Dear Church Leaders (and everyone else)
This article is a follow-up to these posts…


…which point out that official UK government figures show that the inconvenient truth is that the death rate in 2020 increased only after the first lockdown and the “covid response” began. When people panicked. When people were terrified by their governments. When people were told, “Don’t come into hospital if you can help it.”
And when “covid protocols”1 were adopted, including the administration of midazolam and the denial of antibiotics. For those “testing positive for covid” with a fraudulently-conducted test where, in the words2 of its Nobel Prize-winning inventor, “if you do it well, you can find almost anything in anybody”.
2018: an estimated 50,100 excess winter deaths
But in the 2017 to 2018 winter period, there were an estimated 50,100 excess winter deaths in England and Wales.
Not my words, but those of the UK government’s Office for National Statistics:

If it helps anyone to remember the winter of 2018, it was roughly in the middle of Theresa May’s time as Prime Minister. Ed Sheeran (with Perfect) and Drake (with God’s Plan) were dominating the UK singles chart. And The Shape of Water won four Oscars including Best Picture.
For what it’s worth, Wikipedia’s fairly comprehensive summary of 2018 in the United Kingdom makes no mention of the words influenza (or flu), pandemic, respiratory or virus.
But there were lots more people dying than usual.
Here are summaries of the figures based on the official government data for deaths registered monthly and weekly in England and Wales:3
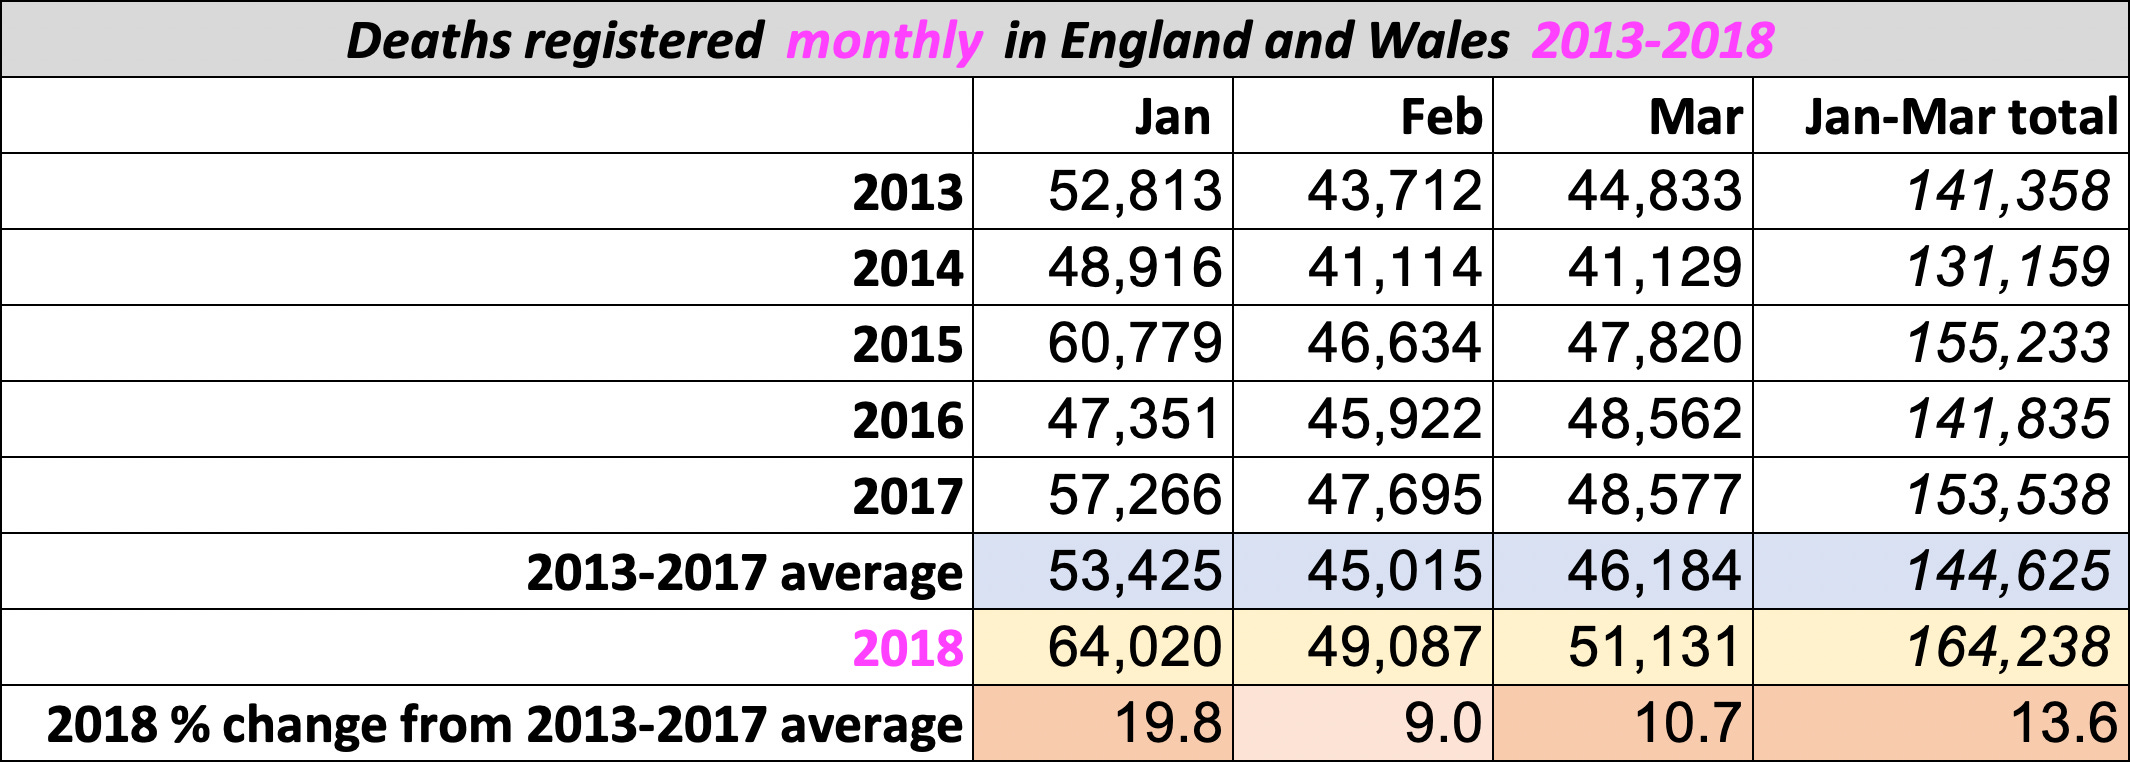
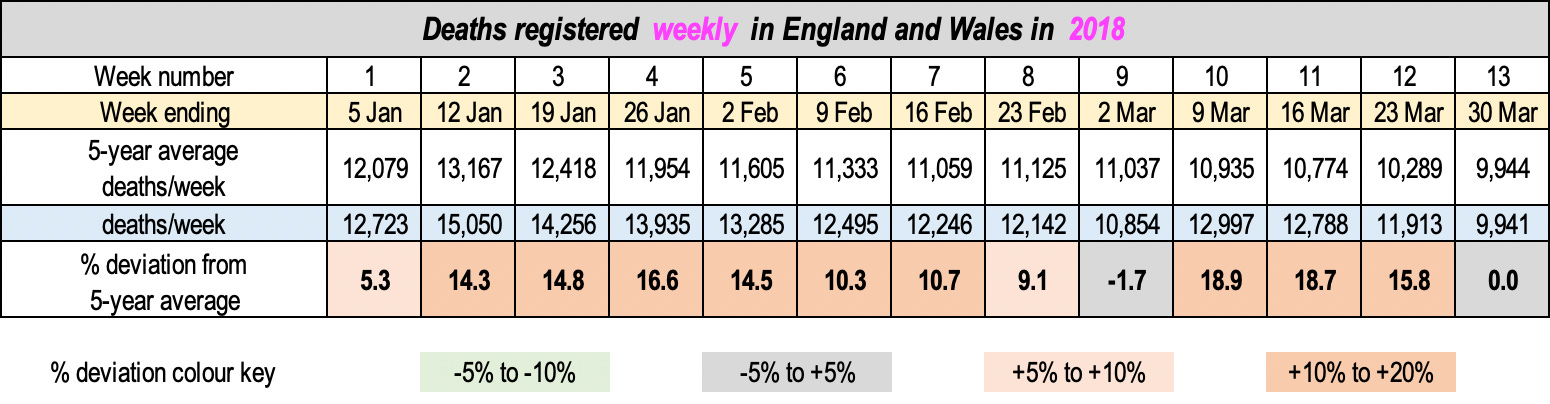
It’s the bottom row that tells the main story. The green -5% to -10% deviation colour key is redundant.
Here is the data represented on a bar chart.

Bear in mind that in an average year, most of those bars would be rather closer to zero.
A bit like in 2020, “the year of the pandemic”…
2020: normal winter death rates
By way of comparison, here are the equivalent tables for 2020:
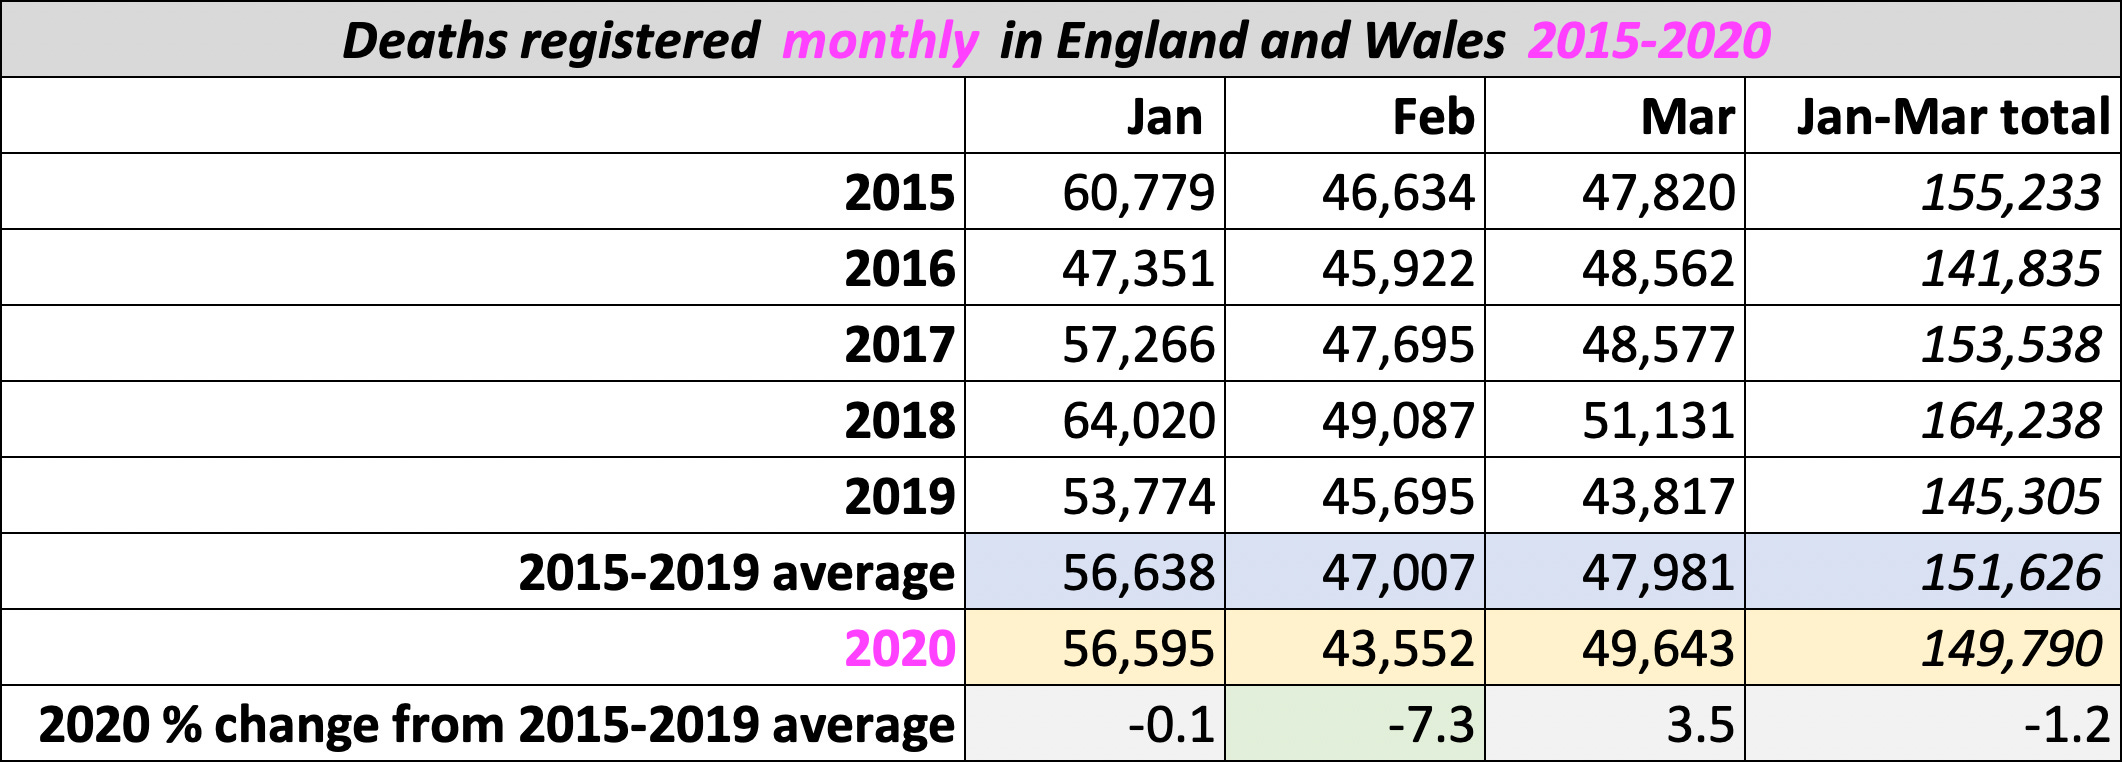

Strikingly, the number of registered deaths from week 4 onwards is actually somewhat lower than usual, even though covid was reportedly circulating.4
Here is the bar chart for 2020:

At the risk of stating the obvious, the numbers for 2020 bear little or no resemblance to those for 2018 — when 50,100 excess deaths went largely unreported. The figures for the “year of the pandemic” look rather more like 2017, which was a distinctly unremarkable year for all-cause mortality.
Until we get to week 13 of course, which ended on 27th March, four days after the Prime Minister told the nation: “I must give the British people a very simple instruction: you must stay at home.”

Which they did. Even when they needed urgent medical treatment.
2023: more winter deaths than usual, provisionally
You may recall that in early 2022 the relentless covid fear-mongering melted away almost as quickly as it had arrived, as the Trusted News Initiative turned its attention to Ukraine.
But the government figures show that in 2023, as in 2018, there were actually substantially more people dying than usual. Especially in January and late March.
Curiously, at the time of writing (February 2025) the data is still apparently provisional:

Below are the (provisional) numbers for 2023 in the same format as those for 2018 and 2020 above.
Because 2020 was an atypical year for death figures — at least from the end of March onwards — a modified average of 2017-2019 and 2021-2022 has been used here, rather than the straight 2018-2022 five-year average. Though as you can see, it makes little practical difference for the first three months of the year. For the record, the number of deaths in January to March was actually 2.4% lower in 2020 than in 2017, despite the extra day (February 29th).5
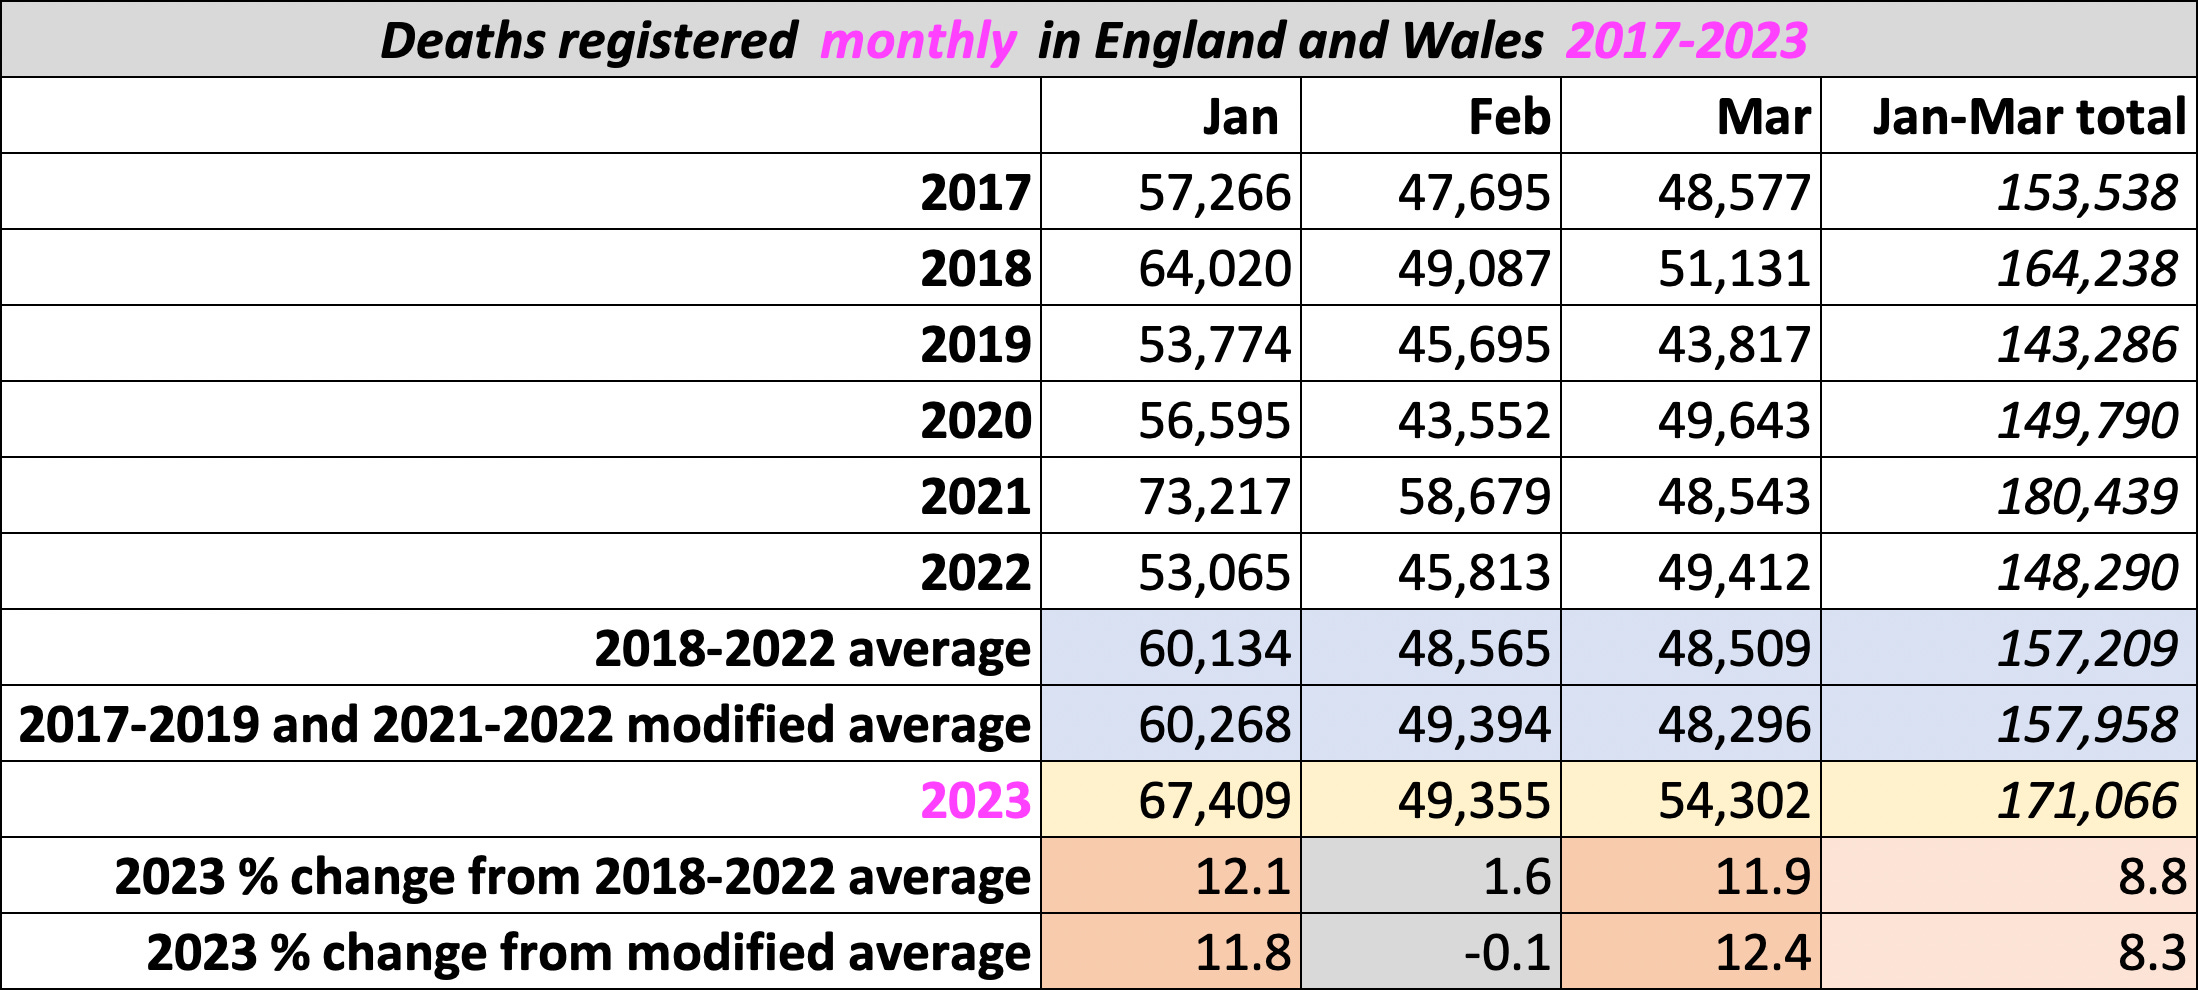
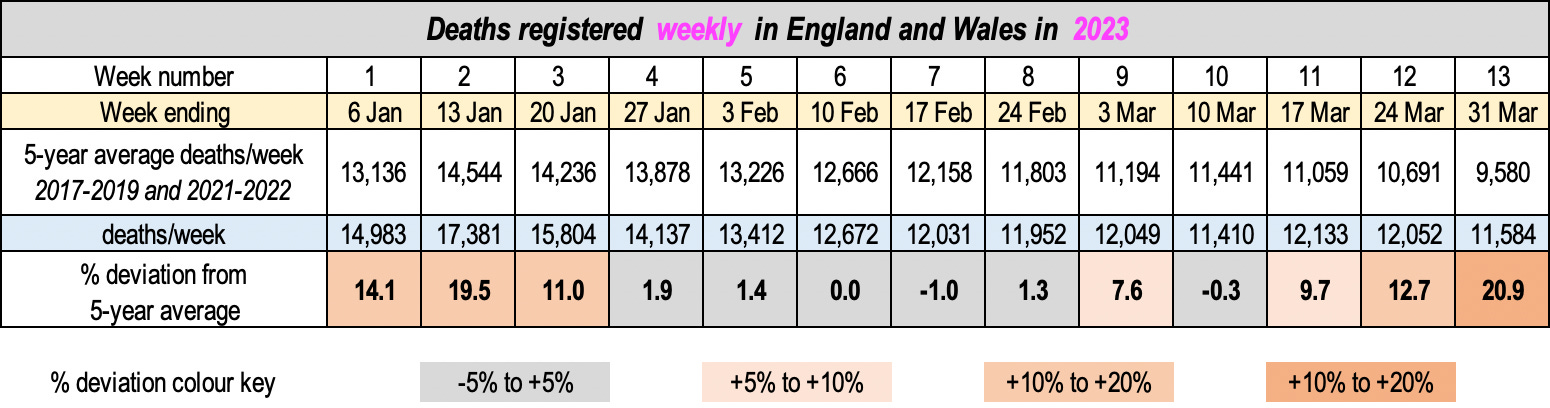
Again, it’s the bottom row that tells the main story. I’ve removed the superfluous green -5% to -10% deviation colour key, and added one for +10% to +20%.
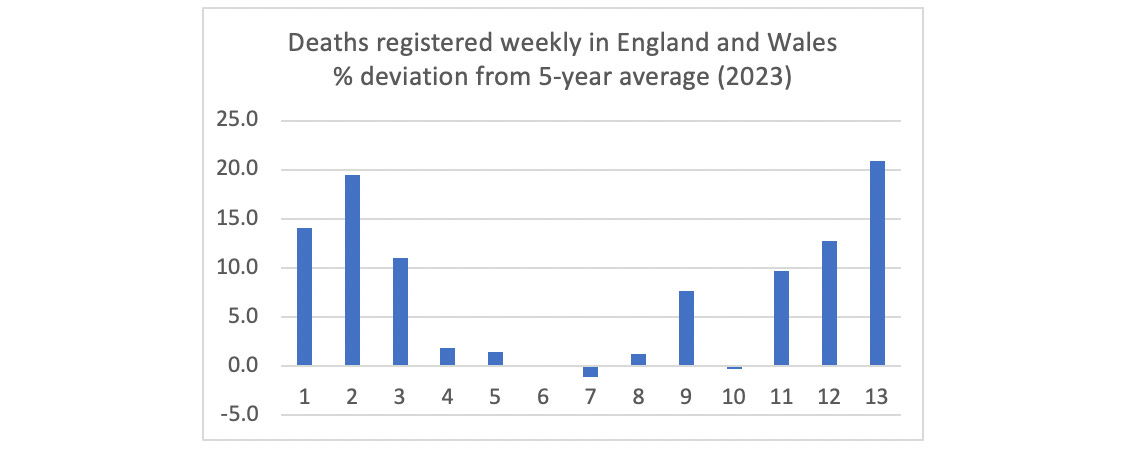
For completeness sake, here is the corresponding bar chart.
As to why there were excess deaths in 2023, one factor is indicated by this NHS key statistics report…
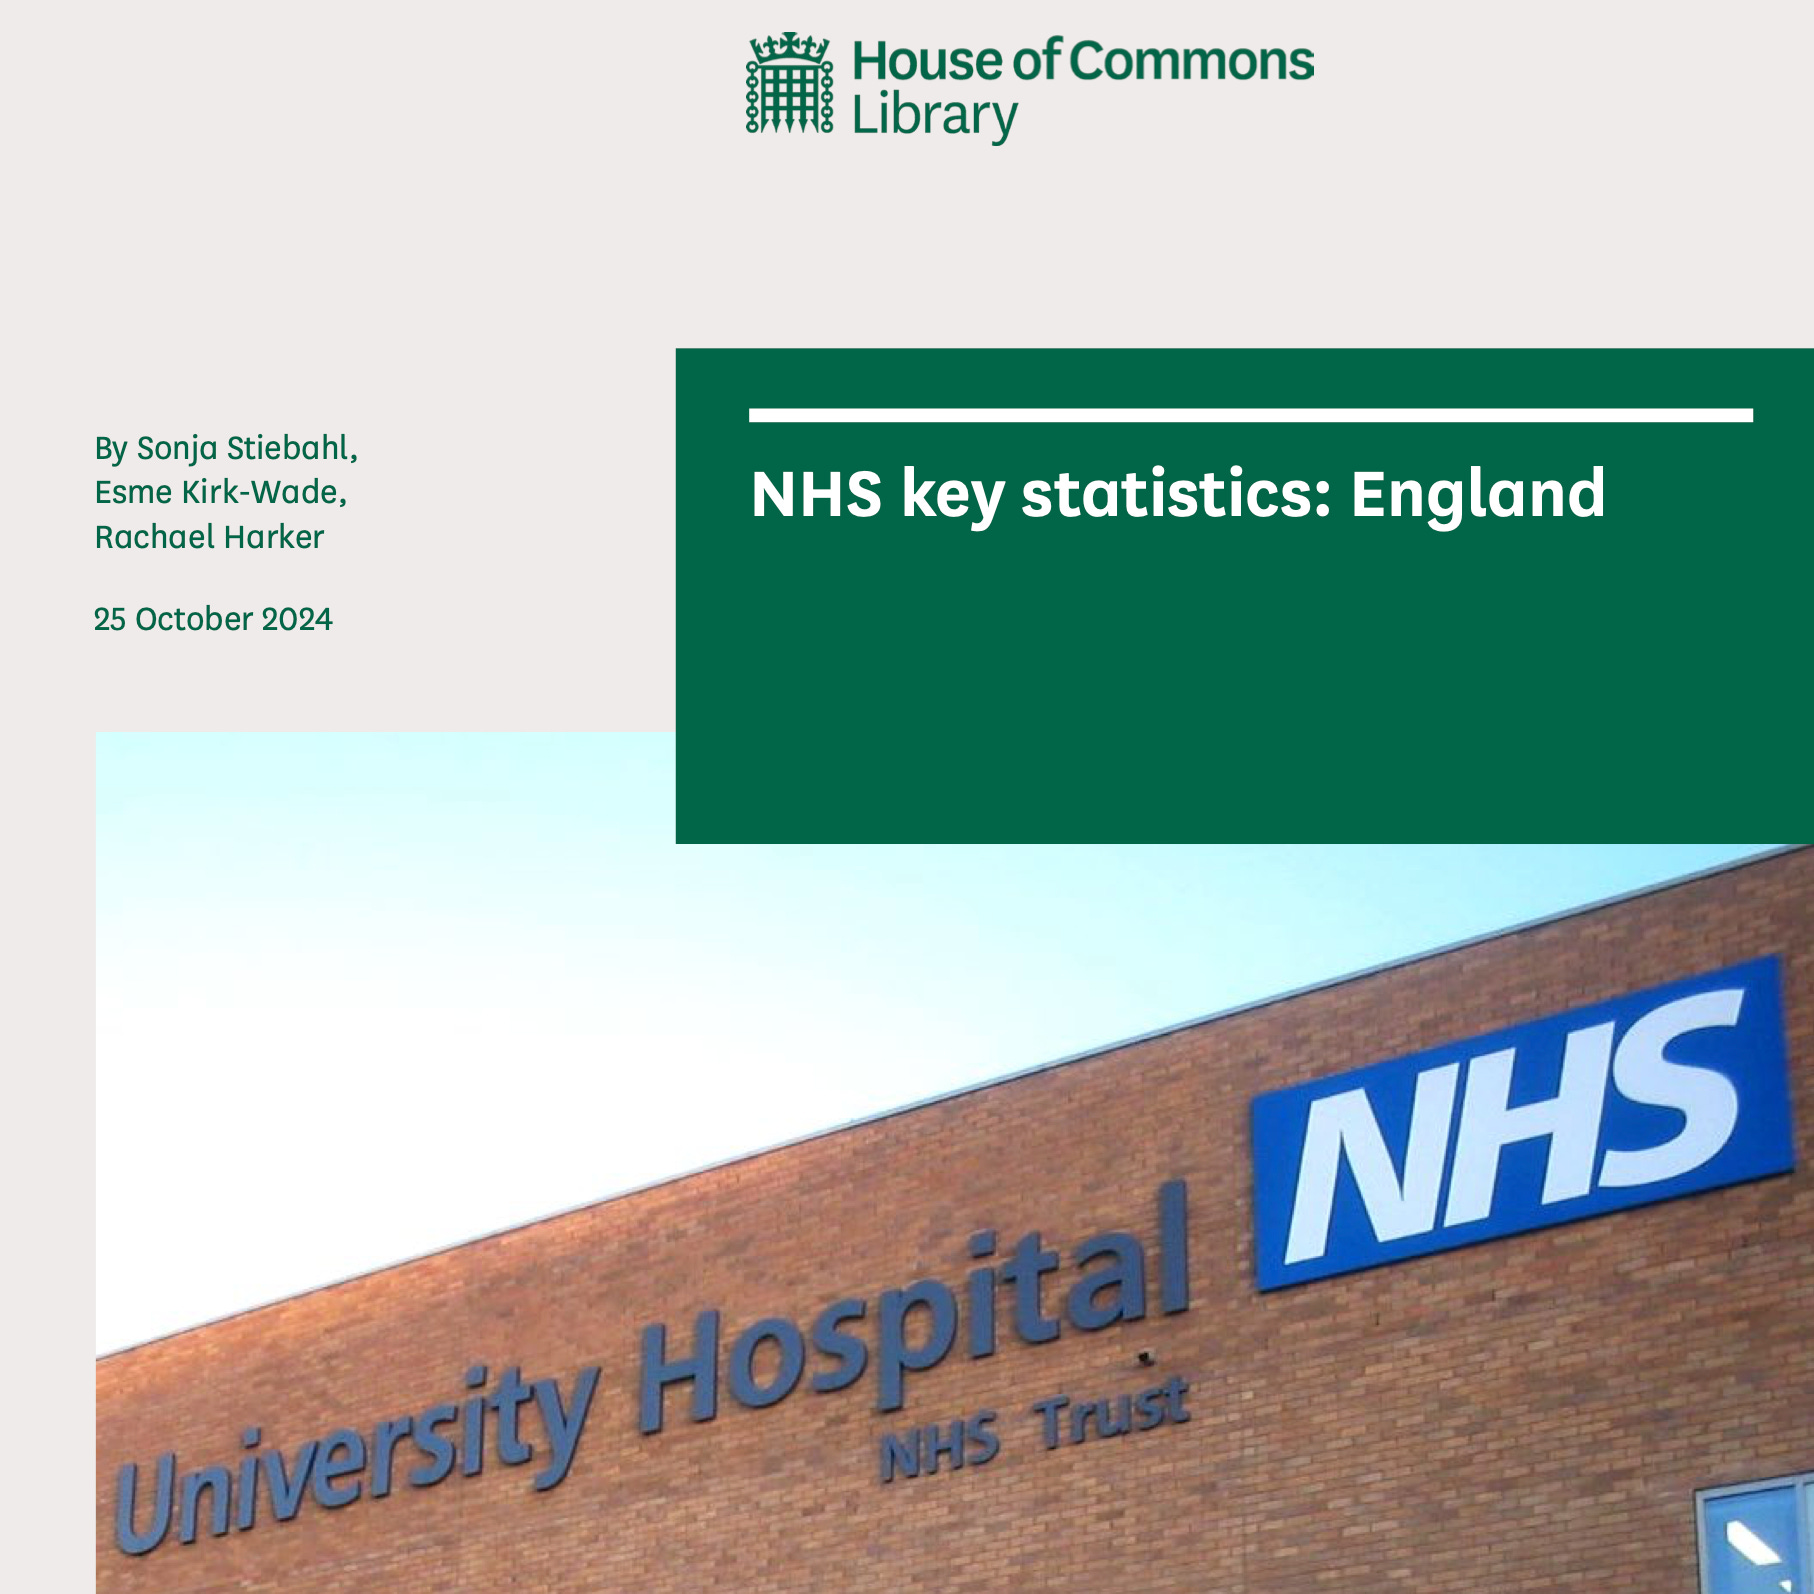
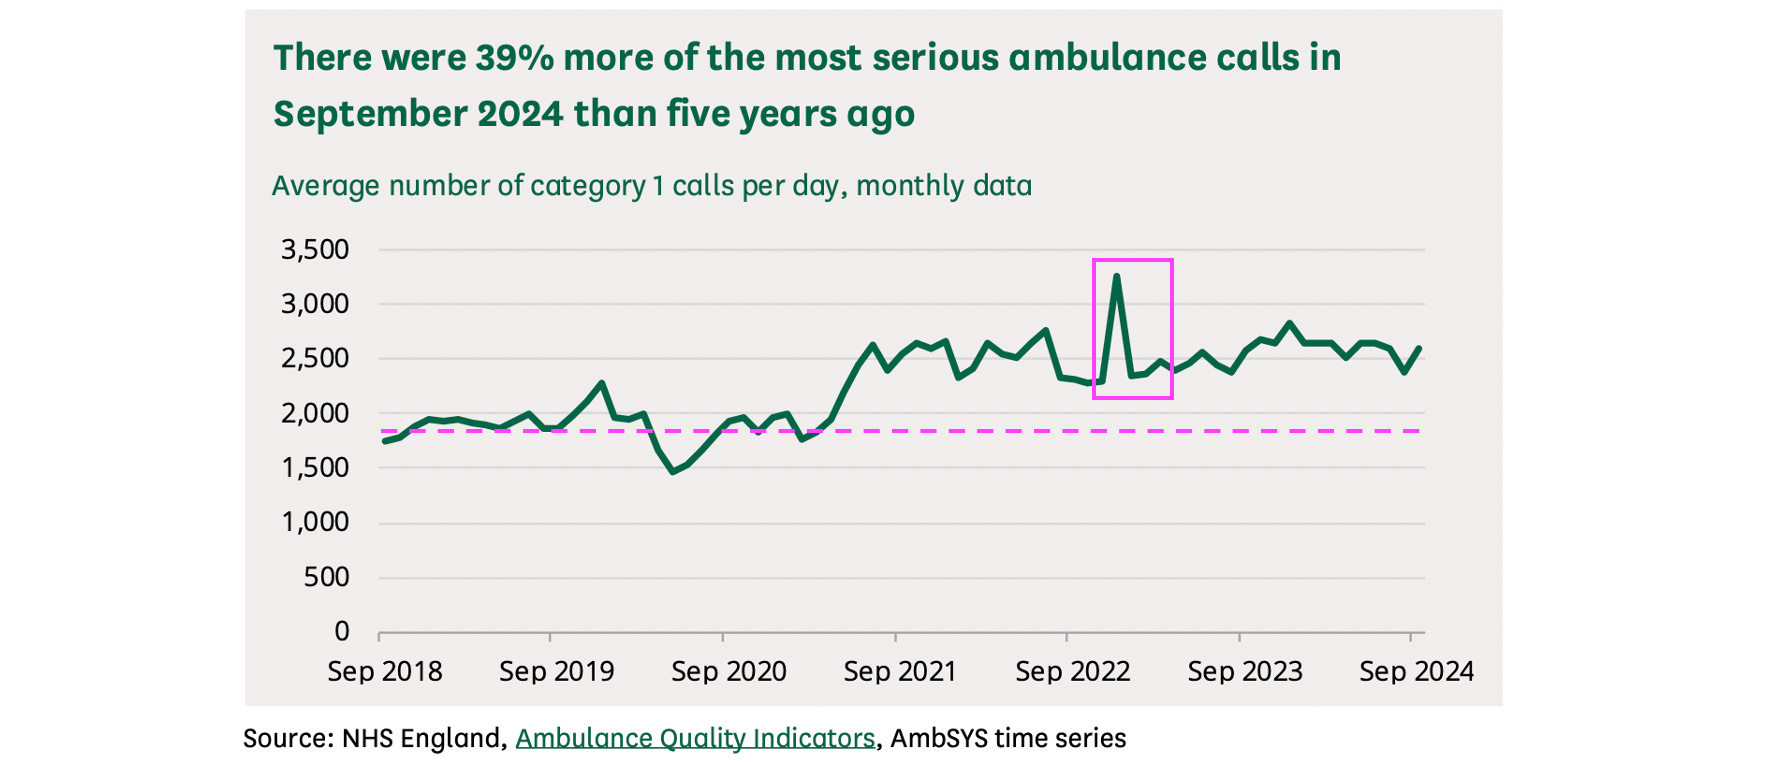
…featuring this chart (p17) for category 1 ambulance calls, i.e. those for life-threatening injuries and illnesses, specifically cardiac arrest:6
But in stark contrast to the hysteria in March 2020, when deaths were at normal levels for the time of year, I don’t recall seeing much in the mainstream media in relation to the excess deaths in March 2023…
Or indeed in relation to the substantial rise in serious ambulance calls that began around mid-2021 and has not returned to baseline…
Related:


Dear Church Leaders most-read articles
Some posts, including a version of this one, can also be found on Unexpected Turns
The Big Reveal: Christianity carefully considered as the solution to a problem
Such as the document NG163, COVID-19 rapid guideline: managing symptoms (including at the end of life) in the community, which is no longer available on the NICE website, but can be viewed e.g. here (archived version) or here (pdf, c/o this related article)
You might have to click twice on that link… and turn off the mute…
NB there will be small effects from the fact that 2016 (like 2020) was a Leap Year. And that registrations of deaths are somewhat delayed during the Easter weekend, at least some of which fell in March in 2013, 2016 and 2018). And of course the population has been rising steadily by 0.5-1% each year — estimated figures for UK population can be found here.
The number of deaths registered in January 2021 was exceptionally high. I doubt we will ever know exactly how many of those deaths were due to the mass rollout of the so-called covid vaccines to the elderly during that month. For context, see e.g. this post:
