


"Can anyone spot the pandemic of 2020? I certainly can't..."
The verdict of a retired statistician and former NHS Head of Department (Clinical Audit)
Dear Church Leaders

John Dee (1527–1608/9) was “a brilliant mathematician, antiquary and astrologer, during the reign of Queen Elizabeth I… [who] called him ‘my philosopher’. He was in a sense, a one-man 'think-tank' of his day and a visionary of the Elizabethan court.”
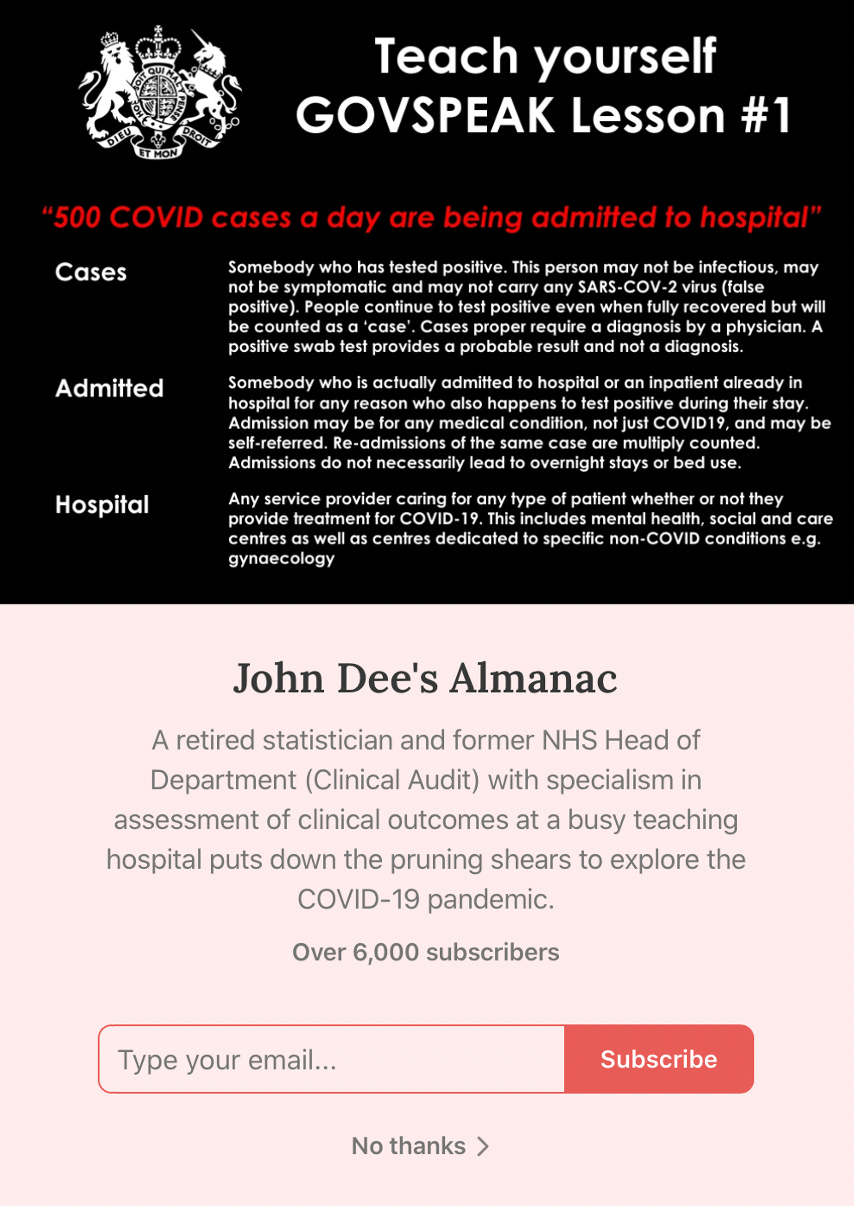
Today, John Dee’s name lives on in the pseudonym of “a retired statistician and former NHS Head of Department (Clinical Audit) with specialism in assessment of clinical outcomes at a busy teaching hospital”. His “almanac” of articles detailing analysis of data from the covid era can be found here:
Most of his post are now behind a paywall, although at £4/month it’s one of the better value Substacks out there. As I understand it, “John Dee” devotes many hours a week of his retirement to his analysis.
And occasionally, an article is made available free to all, at least temporarily. And this is one such — catch it while you can:

It’s essentially an analysis of data from the NHS UK Emergency Care Data Set (ECDS, “the national data set for urgent and emergency care”) for one particular NHS Trust. The period in question is 1st January 2017 to 19th September 2021, which of course includes the covid era.
In the article, John Dee discusses re the gathering and handling of statistics, which is a particular challenge in an Accident and Emergency (A&E) department. He concludes that while the dataset is not perfect, “what data we do have is invaluable.”
Diagnosis
One of the first things he observes is that the dataset does not actually include a code for covid(!) He attempts to circumvent this by coding for respiratory conditions and infectious disease, and then combining those indicators. As he puts it, “these broad-brush cases will include anything and everything we might label as an influenza-like illness (ILI) as well as the mystery that came to be called ‘COVID’”.
Record of treatment
He shortlists the associated treatments likely to be carried out in A&E, with “the net thrown as wide as possible.” He then combines this with “the diagnostic raft for respiratory and infectious disease to nail those admissions to [A&E] that exhibit all the right signs and features; cases that smell of the COVID thing and were treated accordingly.”
Service demand
He then converts almost 2 million individual records to daily counts with a view to tracking A&E service demand from Jan 2017 to Sep 2021. And this is what he finds:

As John Dee puts it, in his characteristically understated manner
I think we can see why ambulances were queuing up empty outside emergency departments to pose for the TV cameras and why hospital staff had time to rehearse those slick dances for TikTok.

He points out that, in the space of a few days in March 2020, the NHS Trust to which this dataset relates went from handling 1,200-1,300 emergency admissions per day to around 500.
Respiratory admissions
He then shows a graphic for respiratory admissions to A&E:

There is certainly a peak. But it is not in March 2020. Rather it is at the end of December 2019 — Boxing Day to be precise — having built steadily from late November.
He recalls that during that time:
…my wife’s school got hit by a mystery illness that was flu-like in nature causing fever, loss of smell, loss of taste, and a dry cough (among other things). Older staff got truly clobbered and were absent for several weeks. I succumbed on 6 December and took 13 weeks to recover, with my toes and feet going blotchy purple at one point. A coincidence, maybe? Similar stories of the ‘worst flu ever’ can be told by many residents in these parts.
And asks:
Does this sound familiar to you? I’m going to guess that many UK residents are able to tell a similar story of something nasty that hit the population some time before, in his words, “the government and their sponsors rolled out a carefully-crafted pandemic.”
Infectious diseases
He then considers infectious diseases similarly:

His verdict:
Can anyone spot the pandemic of 2020? I certainly can’t…
Admissions requiring treatment for respiratory conditions
He concludes the post — part 1 of a series — with a count of admissions requiring any of the various treatments for respiratory conditions:

He notes again that “the best near-pandemic peak” is again observed in late December. And says that there are so few influenza-like illness and covid indicators that for the subsequent article, he will present the data as weekly rather than daily counts…
All of which is consistent with the verdicts of (among others) former Pfizer Vice President Dr Mike Yeadon and former physics professor Denis Rancourt.
Finally, here are some of the comments below the article:

The fraudulent PCR testing was indeed a key element of what happened in 2020/2021.
(For reference: links for PANDA and Jonathan Engler)

If the authorities and mainstream media have deceived us to such an extent about covid, what else might we have been deceived about? And what might we be being deceived about today?
Dear Church Leaders homepage (or search Substack for “Dear Church Leaders”)
The Big Reveal — Christianity carefully considered (click “No thanks” unless you want to subscribe for occasional updates)